
Researchers at Colorado State University are forecasting that no more major hurricanes will make landfall for the remainder of the 2006 hurricane season.
From Colorado State University:
FORT COLLINS – Developing El Nino conditions in the central and eastern Pacific have led the hurricane forecast team at Colorado State to continue to call for below-average activity for the remainder of the 2006 Atlantic basin hurricane season.
The forecasting team of Philip Klotzbach and William Gray today released a new report that calls for two more named storms, one more hurricane and no more intense or major (Saffir/Simpson category 3-4-5) hurricanes for the remainder of the hurricane season (October-November). With the observed activity through September 2006 of nine named storms, five hurricanes and two major hurricanes, a total of 11 named storms are predicted to form in the Atlantic basin during 2006 with six of these predicted to become hurricanes. Two major hurricanes with sustained winds of 111 mph or greater have already formed, and the forecast team does not expect any more major hurricane formations this year.
Inset: Dr. Gray and PhD candidate Klotzbach (photo credit CSU)
There were a couple of interesting FAQs on their website:
Q: Why are there fewer hurricanes at this time in 2006 than there were in 2005?
A: The 2005 hurricane season was very active, especially during the early part of the season (June-July). Although we believe the 2006 hurricane season will end up being close to the average season that occurred between 1950 and 2000, conditions for hurricane development are not as favorable this year as they were at this time last year. Some of the conditions that are less favorable this year are:
- Cooler tropical Atlantic sea surface temperatures
- Dryer tropical Atlantic mid-level atmosphere
- Higher tropical Atlantic sea level pressures
- Stronger tropical Atlantic vertical wind shear
- Warmer sea surface temperatures in the tropical eastern and central Pacific, possibly indicating the development of El Niño conditions this fall/winter.
Q: We’ve had a lot more activity in the Atlantic since 1995. Is global warming the cause of this increased activity?
A: The Atlantic basin tends to go through periods of about 25-35 years with heightened major (Category 3-4-5) hurricane activity and then similar periods of about 25-35 years with less activity. We believe that these multi-decadal variations are mostly due to changes in large-scale ocean circulations referred to as the Atlantic Ocean thermohaline circulation.
How inconvenient this must be for global warming alarmists!
An interesting related article “Hurricane Data Not Cooperating,” from World Climate Report discusses how the hurricane cycle works and that global warming is not involved.
 The 1939 Long Beach Tropical Storm, once a hurricane, was the only Eastern Pacific tropical storm to hit California in known history. The only other tropical cyclone to directly affect California is the 1858 San Diego Hurricane.
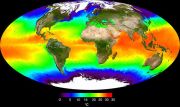 We are in the midst of global warming and yet the ocean temperatures are cooling? Is this correct? New data in a soon-to-be-published paper indicate the opposite of what might be expected during a period of increasing Earth surface temperatures: the top 2500 feet of the ocean lost a tremendous amount of heat between from 2003 through 2005—about 20% of all the heat gained in the last half-century. Considering the thermal inertia the oceans must have, this is astonishing! (Image: Global Ocean Surface Temperatures – courtesy NASA)
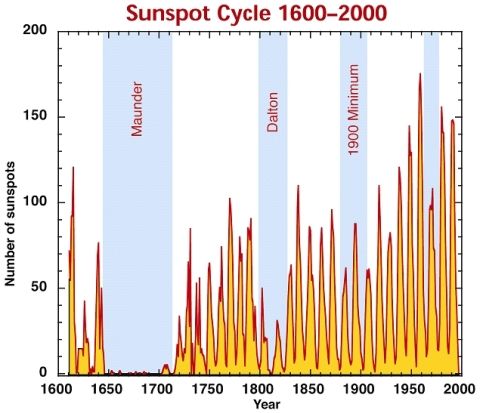
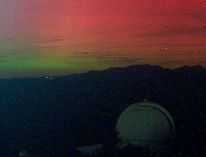 Lately, I’ve been studying solar phenomena because I think the topic is so critical to understanding the natural processes that affect global weather and climate. An interesting segué from the weather aspect, however, is into the subject of auroras – Aurora Borealis in the North and Aurora Australis in the South. What causes them?