 In August and then again in October, I had eye surgeries to replace aging lens elements in my eyes with artificial implants designed to eliminate cataracts and to correct visual acuity.
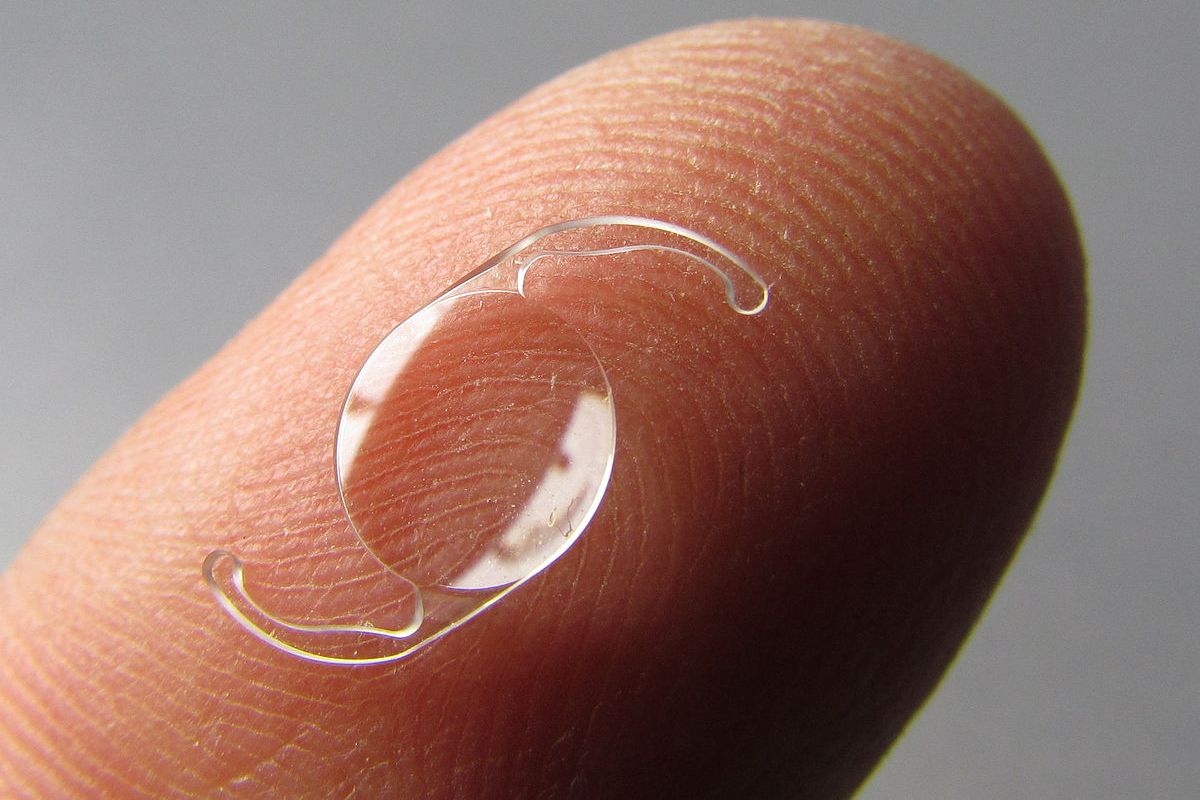
Image: Lens Implant similar to those now in my eyes. Alcon© AcrySof™ Click to enlarge.
My guess is that millions have had their cataracts replaced but this is my story and observations. The surgery is quick and painless with perhaps a small amount of discomfort that quickly abates afterward.
In my case, as I grew older, I became nearsighted and had to wear glasses to fly, drive and do anything that required distance acuity. I removed the glasses to read and work with things close-up. Kind of a pain in the ass without bifocals, and I hated bifocals so I did without. This was before progressive lenses were available.
After a while I wore a contact lens in one eye only so I could see distance, but the uncorrected eye was perfect for reading and working on the computer at home and work. No glasses other than shades were involved. This technique is called “monovision” with one eye corrected for distance and the other used for close work.
Then, about 23 years ago, I had Lasik® surgery to fix my right eye only in order to eliminate the need for a contact lens. Still monovision, but now independent of corrective lenses. I had glasses made for driving where the correction fixed the nearsighted eye and corrected for astigmatism in both eyes. I eventually added progressive corrections so I could seamlessly switch between the distance view and the instrument panel or GPS. That was the status quo up to the surgeries this year.
The left eye surgery was a standard lens replacement while the right eye was a bit more complex, which I will describe below. After the left eye was fixed, one of the first things I noticed was a rather pronounced difference in color perception between the fixed eye and the unfixed eye. With the left eye, white looked white and with the right eye, white looked yellow-ish. Blues were vivid in the left eye and dull with the right eye. I guess I underestimated how big an effect that cataracts have on your vision.
I mentioned that the replacement surgery in the right eye was more complex. When I had Lasik® in that eye I had no idea that it would affect the cataract surgery in that the cornea became distorted. To correct the cornea problem, a second procedure was needed. Before the lens replacement process, they put me under a machine that made contact with the cornea and fired several laser blasts to reshape it. Immediately after that the lens replacement took place with an additional measurement to determine which lens power to use. The surgeon then selected the proper power and completed the surgery.
All the follow up appointments with the ophthalmologist went well. I was now seeing 20/20 with the right eye and the left eye was suitable for close work and reading. This month, I ordered two pairs of prescription glasses – one pair of shades with progressive lenses for driving and daytime outdoor use and another single-vision clear pair for watching TV and other night time use.
Damsel and I were out the last couple of evenings watching the ISS fly over. As a bonus, the crescent Moon, Jupiter and Saturn were gathering together in the southwestern sky in a gorgeous asterism. And Stars! So many Stars all now brightly focused and brilliant. I can SEE!


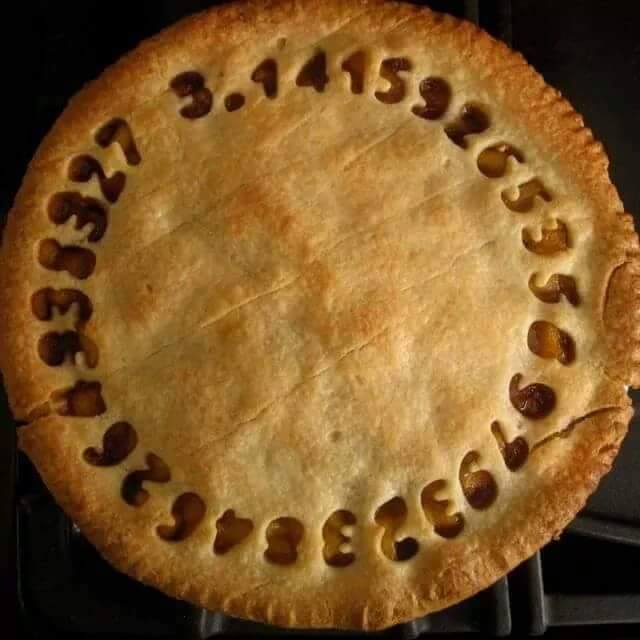
 The date 3/14 has lately become known as “PI Day.” For those of us that have worked in science and engineering disciplines, the constant relating to the ratio of the circumference to the diameter of a circle is ubiquitous and indispensable in a variety of applications.