Environment

West Coast Tropical Storms

Is Southern California about to get a rare weather event? Some meteorologists think that Hurricane John, currently rampaging through Cabo San Lucas, may go as far north as Los Angeles.

From Wikipedia:

1939 Long Beach Tropical Storm

The 1939 Long Beach Tropical Storm, once a hurricane, was the only Eastern Pacific tropical storm to hit California in known history. The only other tropical cyclone to directly affect California is the 1858 San Diego Hurricane.

Storm History

On September 15, a tropical depression formed off the coast of Panama. It quickly strengthened into a hurricane. It tracked northward, instead of the usual westward movement of a typical Eastern Pacific hurricane. The hurricane likely was strong, as it needed to maintain its winds to a northerly latitude. The hurricane’s minimum measured pressure of 28.67 in Hg occurred on September 22. An upper level trough turned it to the northeast, where it weakened due to the cool waters.

Shortly before making landfall on September 25, it weakened to a tropical storm. The storm still managed to hit Long Beach, California as a 50 mph tropical storm, making it the only tropical cyclone in recorded history to hit the state of California. The storm quickly weakened over land, and likely dissipated within a day or two.

My Mom was a 19-year-old newlywed living in Long Beach at the time. She used to tell me about the great hurricane of ’39 and embellish her recount with tales of power blackouts with shutters and screen doors blown off of her house.

Wake Island No More?

UPDATE: Coast Guard Flyover Photos

A reef, a blue lagoon and a coral atoll just barely out of the water — Wake Island may have been completely swept away by Super Typhoon Ioke.

Wake Island — Google Earth Image

From Voice of America

Super Typhoon Ioke has made a direct hit on Wake Island, pounding the tiny U.S. Pacific territory with catastrophic winds of up to 300 kilometers an hour.

Ioke is the strongest central Pacific typhoon in at least 12 years. Forecasters expect the “monster” storm to submerge Wake Island and destroy everything on it that is not made of concrete.

Wake is home to a U.S. Air Force base and a scientific outpost, roughly midway between Hawaii and Japan.

The eye of the typhoon skirted the north edge of the coral atoll Thursday. The U.S. Air Force had already evacuated all of the island’s 188 residents to Hawaii, 3,700 kilometers across the Pacific.

The residents – Air Force personnel and American and Thai contractors – left Monday aboard two U.S. C-17 Globemaster planes. It was the first time the territory was evacuated in nearly 30 years.

More about Wake Island’s history in pictures from Fox News.

A Sudden Ocean Heat Loss

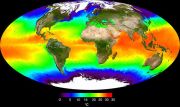
We are in the midst of global warming and yet the ocean temperatures are cooling? Is this correct? New data in a soon-to-be-published paper indicate the opposite of what might be expected during a period of increasing Earth surface temperatures: the top 2500 feet of the ocean lost a tremendous amount of heat between from 2003 through 2005—about 20% of all the heat gained in the last half-century. Considering the thermal inertia the oceans must have, this is astonishing! (Image: Global Ocean Surface Temperatures – courtesy NASA)

A good article on this topic may be found at World Climate Report: A Sea Change in Global Warming?

The sudden cooling may be related to Earth’s Ocean Conveyor Belt, the phenomenon popularized by the movie “The Day After Tomorrow.” Nobody really knows though.

Just when the global warming alarmists are making their case against evil mankind warming the Earth, this has to happen – tsk, tsk.

Correlating Sunspots to Global Climate

Unfamiliar with Solar phenomena? Read what the Sun is and how it does what it does:

More about Why Solar fusion activity is the primary 
mechanism for climate change on Earth
not people!

This is a study in two observations made over the last 400 years: observed annual sunspot numbers and derived global temperatures. The sunspot numbers were recorded by various solar observers since Galileo‘s time. Temperatures have been derived from scientific evidence such as ice and earth cores, and several other valid methods. These were collected by various climate studies and were compiled by NASA scientists to produce an animation of Earth’s climate changes over 399 years between 1599 and 1998.

Climate Change

First look at the NASA video that chronicles global temperature since 1599 AD:

Red indicates warmer surface temperature while blue indicates cooler. The little year clock, although difficult to read, ticks off the years in rapid succession from 1599 through 1998.

You should notice two things as you watch the animation:

  1. The Earth has generally been getting warmer
  2. Extended periods of cooler temperatures have occurred

Annual Sunspot Count

Next, look at this graphic depicting solar cycles and the number of sunspots counted each year:

You should notice two things as you observe this graphic:

  1. The sunspot count per year has been getting generally larger
  2. Extended periods of low sunspot numbers have occurred

Correlating The Two Phenomena Together

And finally, look at this two-minute presentation that ties both observations together:


©2006 Cap’n Bob

A few additional conclusions:

  1. The media will print or broadcast sensationalized headlines to sell copy regardless of scientific value
  2. The media will print or broadcast manipulated science with half-truths and invalid conclusions to damage politicians with whom they do not agree
  3. Politicians seize on these unverified claims in order to blame their opponents
  4. Uneducated/uninformed people are as gullible as ever

References

Update: Read about how cosmic rays interact with solar flux to alter Earth’s climate in a subsequent article.

Behind the Rainbow Curtains

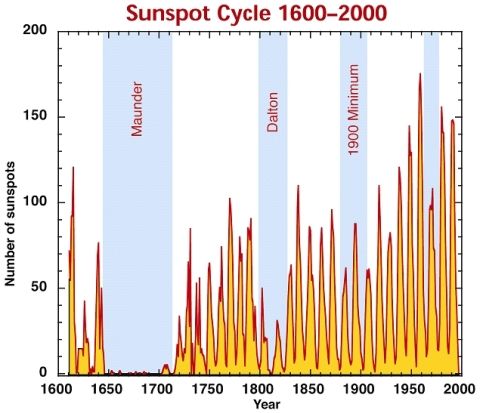
Lately, I’ve been studying solar phenomena because I think the topic is so critical to understanding the natural processes that affect global weather and climate. An interesting segué from the weather aspect, however, is into the subject of auroras – Aurora Borealis in the North and Aurora Australis in the South. What causes them?

Occasionally, we see auroras in Southern California, but it’s an extremely rare sight. The last auroral display I can remember seeing was way back in 1962, although other people have seen them several times since then. The UCLA webcam on Mount Wilson near Los Angeles recorded the image to the right on March 30, 2001.

Anyhow, back to the topic of what causes these elusive Rainbow Curtains — from SOHO and NASA Space Weather:
Continue reading…

Space Radiation Storm

During the years 1999 & 2000 the solar maximum occurred; the time of an 11-year cycle when the Sun exhibits greatest activity. This was the first chance for the Xray Camera on SOHO to observe solar activity at maximum. On July 14, 2000, the camera recorded one of the largest Xray flares to date. In review, this article from NASA recalls the ensuing storm and it’s effects on our planet.

Space Radiation Storm

July 14, 2000 — This morning NOAA satellites and the orbiting Solar and Heliospheric Observatory (SOHO) recorded one of the most powerful solar flares of the current solar cycle. Space weather forecasters had been predicting for days that an intense flare might erupt from the large sunspot group 9077, and today one did.

“Energetic protons from the flare arrived at Earth about 15 minutes after the eruption,” says Gary Heckman, a space weather forecaster at the NOAA Space Environment Center. “This triggered a category S3 radiation storm.”

Right: This SOHO animation of an X-class solar flare was recorded by the spacecraft’s Extreme-ultraviolet Imaging Telescope at 195 angstroms. This recording nicely shows a flare, followed by a torrent of energetic particles that arrived about 15 minutes later, creating snow on the images as the particles bombarded the camera’s electronic detectors. A second flare does not create as much noise. The duration of this sequence is almost a minute, so keep watching.

According to NOAA space weather prediction scales, an S3 storm can cause the following effects on satellites: single-event upsets, noise in imaging systems, permanent damage to exposed components/detectors, and decrease of solar panel currents. It can also expose air travelers at high latitudes to low levels of radiation, the equivalent of a brief chest x-ray.

[more]

Presently, the sun is between maxima. Although the sun is fairly quiet now, there can still be the occasional flare up.