Environment

Salton Sea from Keys View

We visited the Joshua Tree National Park today. As always when we come here, we drove to Keys View to see the spectacular panorama overlooking the Coachella Valley and Salton Sea. This photo (slightly enhanced to reduce the haze) shows the Salton Sea just above the tops of the mountain ridge in the foreground. Click on the image to enlarge.

salton.jpg

Anthropogenic Warming – It’s True!

It’s true, but not on a global scale . . .

Increases in local temperature averages are due, in large part, to URBANIZATION. For those of us who bother to seek out actual scientific studies, we can clearly see that Urban Heat Islands are the cause of localized increases in temperature. Consider this study from the Center for the Study of Carbon Dioxide and Global Change:

The Urban Heat Island of Mexicali, Mexico

Background

Mexicali City borders the United States at the northern end of Mexico’s Baja California. It is an urban settlement that had its beginnings in the first decade of the 20th century. At that point in time it had an area of approximately 4 km2; but by 1980 it covered an area of a little over 40 km2, and by 2005 it covered something in excess of 140 km2.

What was done

Working with daily records of maximum and minimum temperature from six weather stations “in Mexicali City and its surroundings” covering the period 1950-2000, and with “a climatic network of rural and urban weather stations in Mexicali and its valley and the Imperial Valley, California” over the “contemporary period (2000-2005),” the authors characterized the spatial and temporal development of the city’s urban heat island over the latter half of the 20th century and the first five years of the 21st century.

What was learned

Garcia Cueto et al. state that Mexicali City “changed from being a cold island (1960-1980) to a heat island with a maximum intensity of 2.3°C in the year 2000, when it was compared with rural weather stations of Imperial, California,” noting that “the replacement of irrigated agricultural land by urban landscapes, anthropogenic activity and population growth, appear to be the major factors responsible for the observed changes.” And from the “more updated information (2000-2005),” they found that “the greatest intensity of the urban heat island was in winter with a value of 5.7°C, and the lowest intensity in autumn with 5.0°C.”

What it means

The results of this study clearly demonstrate that population growth and the clustering of people in cities can lead to localized warming (in areas where temperatures are routinely measured) that is both more rapid and much greater (by as much as an order of magnitude, in fact) than what climate alarmists typically attempt to characterize as the “unprecedented” warming of the 20th century. And that population-growth-induced warming — spread across the world — has likely contributed, in large part, to what they wrongly construe to be CO2-induced global warming.

Simply said, CO2 is NOT a dangerous gas.

Peanuts Thrive in CO2 Rich Atmosphere

You might ask “what does increased levels of CO2 have to do with peanuts?” Well, the climate experts that blog at World Climate Report have a baseball-related explanation:

Baseball’s Back – With More Peanuts Than Ever

peanutFor many citizens in the USA, this has been a winter for the ages. From no end of storms in the Southwest to record-breaking snow in the Northeast, this has been one long winter. But in Arizona and Florida, the boys of summer are dusting off their bats and balls and spring training is now underway. Fans are flocking back to the ballparks, and our consumption of peanuts is on the rise. American will eat more than 600 million pounds of peanuts this year at ballparks around the country (and elsewhere), we will eat over 700 million pounds of peanut butter, and we will spend over four billion dollars on our peanut habit.

What’s the climate change rub? Rising atmospheric carbon dioxide levels are enhancing peanut productivity and protecting the crop from the harmful impacts of atmospheric pollutants such as ozone. Which means more peanuts to go around. So next time you raise your hand and call out “Hey Beerman, how about a cold one and jumbo bag of peanuts!” remember that elevated atmospheric CO2 is helping to keep your bag full. [more]

C’mon Global Warming

SOHO Extreme ultraviolet Imaging Telescope (EIT) solar images last summer and today:

then-now.jpg

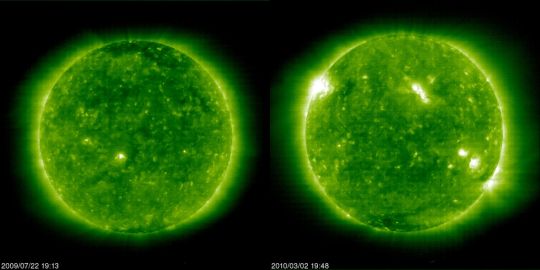
Solar activity is starting to increase again after what has been a relatively long quiet spell associated with the minimum part of the solar cycle. February was the first month in quite some time where there were sunspots every day of the month. In the image above from last July (left), the lone bright area below the equator near the center was not associated with a sunspot, but was in an area of magnetic activity.

Remember that the sun is a star, like all stars, whose business is to fuse lighter elements into heavier ones; our sun fuses hydrogen into helium. This process results in chaotic magnetic behavior of the solar plasma which fluctuates in intensity over an eleven year cycle. We wrote “Ultimate Global Warming – SPF 2 Million Won’t Be Enough” to describe the process.

Evidently, we’re on the upswing after what some scientists (real ones, not climate liars) say was a very extended inactive period, which some feared would put the sun into many years of minimal activity. It is likely that such an extended period, the Maunder Minimum, was the cause of the “Little Ice Age” during the 1600s and 1700s. We wrote “Correlating Sunspots to Global Climate” which illustrates the phenomenon using animations and graphics.

Personally, after the winter we have been having in North America this season, I will be glad to see the sunspots bring us back to our subtropical weather patterns. Old folks like warmer weather, y’know. C’mon global warming! 🙂

Diaz Lake – A Panoramic View

Diaz Lake is located in the Owens Valley, California, It has the distinction of having recently been formed as the result of a large earthquake. Click on the panoramic thumbnail for the full-sized version.

diaz-lake-pan.jpg

From Wikipedia:

Diaz Lake is located just south of Lone Pine, California, United States in Owens Valley. The lake was formed by the 1872 Lone Pine earthquake when 18 mi (29 km) of the Owens Valley dropped approximately 20 feet (6 m) and a new spring opened, causing water to fill the lowland.

The lake was named for the Diaz family who established a ranch here when brother Rafael and Eleuterio Diaz emigrated from Chile in the 1860’s. They owned and operated a successful cattle ranch until the land was sold to the city of Los Angeles.

Year-round fishing is available, and the “Diaz Lake Fish Derby” is held the first Saturday in March.

Snow Capped San Gabriel Mountains

snow

In this El Niño year, the snow levels dropped to below 5000 feet in the San Gabriels, normally not seen with snow on the southern slopes. Damsel took this image (cropped to make a panorama) after the rain passed the other day. Lingering clouds can be seen topping some of the peaks. Click on the image to see the full-sized panoramic image – don’t forget to use the scroller to see the whole image.