Global Warming

The Sky is Falling

Just wait for all the Chicken Little types to try and blame this obviously solar-related phenomenon on Anthropogenic CO2 production. From NASA Science:

A Puzzling Collapse of Earth’s Upper Atmosphere

July 15, 2010: NASA-funded researchers are monitoring a big event in our planet’s atmosphere. High above Earth’s surface where the atmosphere meets space, a rarefied layer of gas called “the thermosphere” recently collapsed and now is rebounding again.

“This is the biggest contraction of the thermosphere in at least 43 years,” says John Emmert of the Naval Research Lab, lead author of a paper announcing the finding in the June 19th issue of the Geophysical Research Letters (GRL). “It’s a Space Age record.”

graphs_circle.jpg

Image: Atmospheric Density over time.

The collapse happened during the deep solar minimum of 2008-2009—a fact which comes as little surprise to researchers. The thermosphere always cools and contracts when solar activity is low. In this case, however, the magnitude of the collapse was two to three times greater than low solar activity could explain.

“Something is going on that we do not understand,” says Emmert.

Gee . . . Ya think?

STEREO Spacecraft Approaching Diametric Opposition

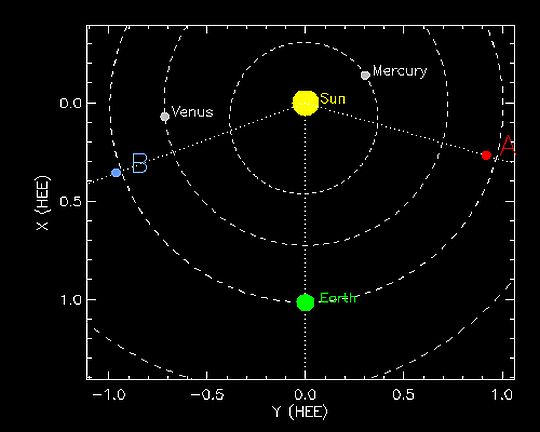
Why would that be significant? Well, it would allow for a full 4PI (360×360°) view of the sun. The animated movie of the sun on STEREO’s Website currently has a gap in the coverage of the sun. The spacecraft are in a heliocentric orbit drifting away from the Earth, one leading and one lagging. This diagram shows the current position of spacecraft A (ahead) and B (behind). The scale is in astronomical units, the average distance between the earth and sun.

Sun-monitoring instrumentation on spacecraft like SOHO and STEREO have gone a long way in discovering what makes the sun behave in mysterious ways. Also, the data coming back (when not intentionally distorted by the IPCC, the CRU or NASA’s James Hansen) can be used to chart the relationship between solar activity and global climate.

stereo.jpg

Anthropogenic Warming – It’s True!

It’s true, but not on a global scale . . .

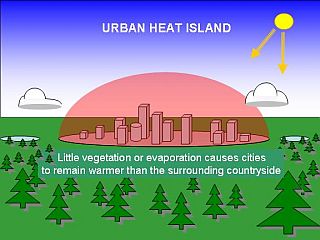
Increases in local temperature averages are due, in large part, to URBANIZATION. For those of us who bother to seek out actual scientific studies, we can clearly see that Urban Heat Islands are the cause of localized increases in temperature. Consider this study from the Center for the Study of Carbon Dioxide and Global Change:

The Urban Heat Island of Mexicali, Mexico

Background

Mexicali City borders the United States at the northern end of Mexico’s Baja California. It is an urban settlement that had its beginnings in the first decade of the 20th century. At that point in time it had an area of approximately 4 km2; but by 1980 it covered an area of a little over 40 km2, and by 2005 it covered something in excess of 140 km2.

What was done

Working with daily records of maximum and minimum temperature from six weather stations “in Mexicali City and its surroundings” covering the period 1950-2000, and with “a climatic network of rural and urban weather stations in Mexicali and its valley and the Imperial Valley, California” over the “contemporary period (2000-2005),” the authors characterized the spatial and temporal development of the city’s urban heat island over the latter half of the 20th century and the first five years of the 21st century.

What was learned

Garcia Cueto et al. state that Mexicali City “changed from being a cold island (1960-1980) to a heat island with a maximum intensity of 2.3°C in the year 2000, when it was compared with rural weather stations of Imperial, California,” noting that “the replacement of irrigated agricultural land by urban landscapes, anthropogenic activity and population growth, appear to be the major factors responsible for the observed changes.” And from the “more updated information (2000-2005),” they found that “the greatest intensity of the urban heat island was in winter with a value of 5.7°C, and the lowest intensity in autumn with 5.0°C.”

What it means

The results of this study clearly demonstrate that population growth and the clustering of people in cities can lead to localized warming (in areas where temperatures are routinely measured) that is both more rapid and much greater (by as much as an order of magnitude, in fact) than what climate alarmists typically attempt to characterize as the “unprecedented” warming of the 20th century. And that population-growth-induced warming — spread across the world — has likely contributed, in large part, to what they wrongly construe to be CO2-induced global warming.

Simply said, CO2 is NOT a dangerous gas.

The Science Behind Anthropological Global Warming

Junk Science

 
The Science Behind AGW

The well-known terrorist group, Greenpeace, is urging “mass civil disobedience” to intimidate those who are skeptical about global warming:

If you’re one of those who believe that this is not just necessary but also possible, speak to us. Let’s talk about what that mass civil disobedience is going to look like.

If you’re one of those who have spent their lives undermining progressive climate legislation, bankrolling junk science, fueling spurious debates around false solutions, and cattle-prodding democratically-elected governments into submission, then hear this:

We know who you are. We know where you live. We know where you work.

Bring it on, Asswipes . . .

Peanuts Thrive in CO2 Rich Atmosphere

You might ask “what does increased levels of CO2 have to do with peanuts?” Well, the climate experts that blog at World Climate Report have a baseball-related explanation:

Baseball’s Back – With More Peanuts Than Ever

peanutFor many citizens in the USA, this has been a winter for the ages. From no end of storms in the Southwest to record-breaking snow in the Northeast, this has been one long winter. But in Arizona and Florida, the boys of summer are dusting off their bats and balls and spring training is now underway. Fans are flocking back to the ballparks, and our consumption of peanuts is on the rise. American will eat more than 600 million pounds of peanuts this year at ballparks around the country (and elsewhere), we will eat over 700 million pounds of peanut butter, and we will spend over four billion dollars on our peanut habit.

What’s the climate change rub? Rising atmospheric carbon dioxide levels are enhancing peanut productivity and protecting the crop from the harmful impacts of atmospheric pollutants such as ozone. Which means more peanuts to go around. So next time you raise your hand and call out “Hey Beerman, how about a cold one and jumbo bag of peanuts!” remember that elevated atmospheric CO2 is helping to keep your bag full. [more]

The Weather Is Not Climate Issue

We have been hearing from climate alarmists lately that all this colder-than-usual winter weather is a result of global warming. In particular, winter storms and cold weather in Europe, like that which immobilized ferries and other vessels in the Baltic Sea this week. They argue that science has concluded it to be so – climate change is causing all this to happen.

Well, uh, no. It seems that even the liars at the IPCC haven’t tried to pass that crap off . . .

From World Climate Report.

The winter of 2009-2010 has produced its fair share of winter storms in the Northern Hemisphere – recall that President Obama arrived back in Washington from his appearance at the Copenhagen climate conference only to find the White House grounds buried under near-record amounts of snow. Europe and Asia have seen their share of large winter storms as well during the 2009-2010 winter. Hardly a large storm goes by without someone, somewhere suggesting that whatever we are seeing, it is related to “climate change”.

If one looked no further than the Technical Summary of the IPCC, they would discover that the IPCC is rather quiet on this subject with no claims whatsoever that winter storms will increase in frequency, magnitude, duration, or intensity due to the ongoing changes in atmospheric composition. [read the rest]

Emphasis added.

C’mon Global Warming

SOHO Extreme ultraviolet Imaging Telescope (EIT) solar images last summer and today:

then-now.jpg

Solar activity is starting to increase again after what has been a relatively long quiet spell associated with the minimum part of the solar cycle. February was the first month in quite some time where there were sunspots every day of the month. In the image above from last July (left), the lone bright area below the equator near the center was not associated with a sunspot, but was in an area of magnetic activity.

Remember that the sun is a star, like all stars, whose business is to fuse lighter elements into heavier ones; our sun fuses hydrogen into helium. This process results in chaotic magnetic behavior of the solar plasma which fluctuates in intensity over an eleven year cycle. We wrote “Ultimate Global Warming – SPF 2 Million Won’t Be Enough” to describe the process.

Evidently, we’re on the upswing after what some scientists (real ones, not climate liars) say was a very extended inactive period, which some feared would put the sun into many years of minimal activity. It is likely that such an extended period, the Maunder Minimum, was the cause of the “Little Ice Age” during the 1600s and 1700s. We wrote “Correlating Sunspots to Global Climate” which illustrates the phenomenon using animations and graphics.

Personally, after the winter we have been having in North America this season, I will be glad to see the sunspots bring us back to our subtropical weather patterns. Old folks like warmer weather, y’know. C’mon global warming! 🙂