Why Solar fusion activity is the primary
mechanism for climate change on Earth
Know Thy Star
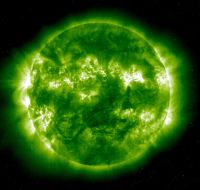 The Sun is a star — a main sequence star whose business is to fuse hydrogen atoms into helium atoms. Fusion is a steady but somewhat unstable and potentially violent thermonuclear process. During fusion, solar mass, heat and pressure force hydrogen atoms to combine to become helium atoms. This transformation of atomic states produces energy in the form of multispectral photons (visible light, heat, x-rays, ultra-violet, cosmic rays, magnetic flux, radio-frequency emissions and more). We all know the effects of UV on skin disease, and lately, the effects of magnetic flux on the electrical grid. The Sun, like fire, can be good and bad.
One day, far in the future, the Sun will run out of hydrogen to fuse and will become a red giant star as it attempts to fuse it’s residual helium into even heavier elements – but since it is a relatively small star, it falls short of the mass and energy needed to do so. The Sun will gradually expand to an unsustainable maximum where it suddenly collapses, and then goes nova, literally exploding its outer shell into space while its high-density core remains and will become a white dwarf star. The explosion and collapse will occur in about five billion years. In the meantime, the Sun will continue its steady fusion process and occasional chaotic behavior, which (as meteorologists and stockbrokers know) cannot accurately be predicted.
Yogi Berra’s Law: “You can observe a lot just by watching.”
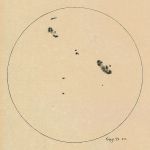 Over the last four hundred years, astronomers and others have recorded their observations of the Sun; they observed a phenomenon known as “sunspots” and jotted down when they saw them, how many there were and how big, of course. Galileo, among other observers, often drew sketches of the solar disc depicting sunspot orientation. The historical records from this period are quite compelling.
Image: A sketch of the sun made by Galileo in June 1613 (NASA).
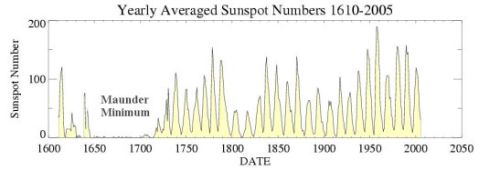
And those records appear in the graphic below (courtesy NASA) along with subsequent observations. You should notice that the number of sunspots (which corresponds to the intensity of solar activity) shrinks and grows over an eleven year (or so) cycle. Some cycles have greater intensity than others. You should also notice a gap in this behavior where the graphic is labeled “Maunder Minimum,” during the years (approximately) between 1645 and 1715. During that 70 year period, less than one sunspot per year (on average) was observed. During that same period, the Earth experienced what is called the “Little Ice Age” where winters were bitterly cold.
Let’s review:
- when there are many sunspots, the planet is warmer
- when there are few sunspots, the planet is colder
- recent discoveries indicate that the oceans were much warmer in the prehistoric past and that greenhouse gasses were abundant
- there is ample evidence that prehistoric glaciation and ice ages occurred
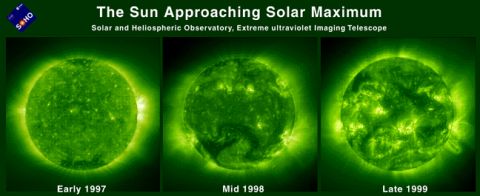
Science makes a lot of assumptions based on observations. Maybe it’s the things we can’t observe that makes the Sun behave the way it does. There is evidence that the Sun’s rate of rotation oscillates over time, its magnetic fields wander and vary in strength, and of course has occasional Coronal Mass Ejections (prominences). The Sun may actually be, to a somewhat lesser degree than most, a variable star; some variables’ light and radiation fluctuate by 100 to 1 over short periods of time (months or years our time). Were the Sun to be in that category, however, it is doubtful that there would be any life on Earth. The following images in ultraviolet light clearly illustrate the contrasts in solar activity from the last sunspot cycle in the run up to maximum (courtesy SOHO):
Conclusions:
- global climate is influenced primarily by the Sun
- greenhouse gasses would be evident without man’s puny influence during solar maximums, as was proven to have been the case eons in the past
- political pressure has been exercised over certain unscrupulous elements in the scientific community to manipulate data to get an inaccurate conclusion for political advantage
One more thing – the Antarctic Ozone Hole gets larger in the antarctic spring and smaller in the antarctic fall. Sunshine opens the hole, darkness closes it. The hole also grows and shrinks in direct proportion to the number of sunspots. No surprise here is there? Could the “chlorofluorocarbon emissions cause atmospheric ozone depletion” meme also be a myth?
Global Warming doomsayers ought to re-think what really affects the climate and stop beating their broken drum. Do the numbers and have a closer look at our stellar companion, the greatest of all climatological influences, the giver of life, and, ultimately the taker as well.
Reference for Maunder Minimum data: Wikipedia – Maunder Minimum
UPDATE: Read more about Correlating Sunspots to Global Climate in a subsequent article.

There is not much new in a collection of articles about global warming and sea level rise in the latest issue of Science. As such, it is mostly recycled and repackaged information that the head of the American Association for the Advancement of Science (AAAS), Donald Kennedy, can take down from New York Avenue in DC to Capitol Hill, to scare politicians into doing what it wants, which is an immediate cap on U.S. emissions of carbon dioxide.
 SACRAMENTO — An anticipated surge in long-haul truck traffic from Mexico will deliver more than loads of produce, electronics and clothing to Southern California.
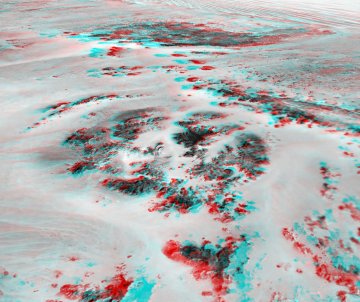