Science

NASA Measures a 31 Inch Landshift

The 7.2 Baja earthquake of April 4, 2010 and numerous aftershocks have displaced the land around Calexico, CA, about 31 inches. From NASA:

NASA Radar Images Show How Mexico Quake Deformed Earth

PASADENA, Calif. — NASA has released the first-ever airborne radar images of the deformation in Earth’s surface caused by a major earthquake — the magnitude 7.2 temblor that rocked Mexico’s state of Baja California and parts of the American Southwest on April 4.

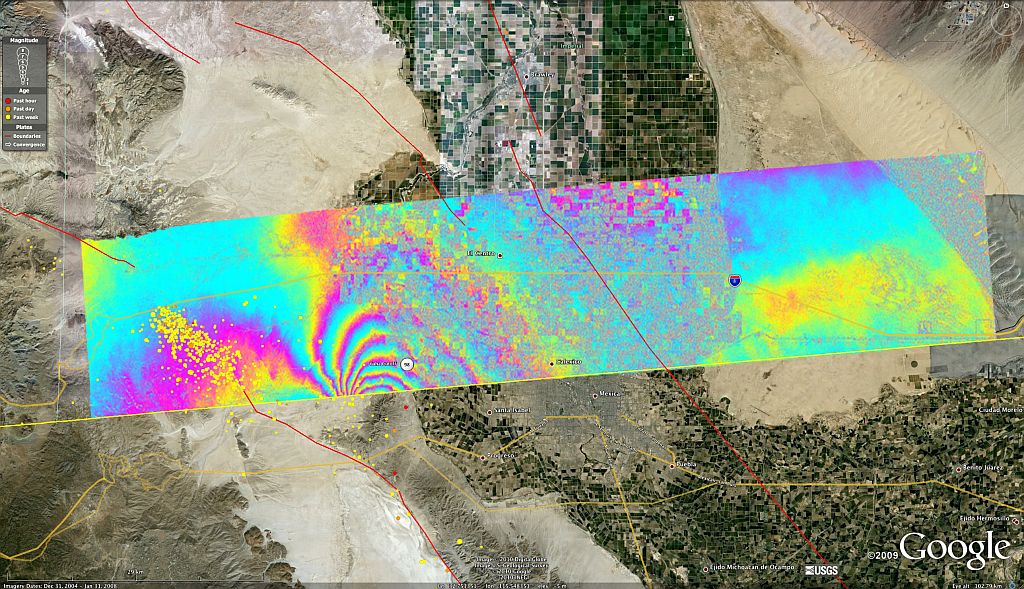
The data reveal that in the area studied, the quake moved the Calexico, Calif., region in a downward and southerly direction up to 80 centimeters (31 inches). The maps can be seen at: http://www.nasa.gov/topics/earth/features/UAVSARimage20100623.html .

A science team at NASA’s Jet Propulsion Laboratory, Pasadena, Calif., used the JPL-developed Uninhabited Aerial Vehicle Synthetic Aperture Radar (UAVSAR) to measure surface deformation from the quake. The radar flies at an altitude of 12.5 kilometers (41,000 feet) on a Gulfstream-III aircraft from NASA’s Dryden Flight Research Center, Edwards, Calif.

The team used a technique that detects minute changes in the distance between the aircraft and the ground over repeated, GPS-guided flights. The team combined data from flights on Oct. 21, 2009, and April 13, 2010. The resulting maps are called interferograms.

interferometry

Overview of the UAVSAR interferogram of the magnitude 7.2 Baja California earthquake of April 4, 2010, overlaid atop a Google Earth image of the region. Major fault systems are shown by red lines, while recent aftershocks are denoted by yellow, orange and red dots. Image credit: NASA/JPL/USGS/Google

Click on the image to enlarge.

(More)

Fathers Day Flare

The new solar cycle antes up a massive CME for Fathers day. From SpaceWeather.com . . .

FATHER’S DAY BLAST: Consider it a Father’s Day gift … from the sun. This morning around 1 a.m. UT, magnetic fields on the sun’s eastern limb became unstable and erupted, producing one of the most spectacular explosions of the year. NASA’s Solar Dynamics Observatory recorded the action:

The explosion did not cause a solar flare (a flash of electromagnetic radiation) but it did hurl a massive cloud of magnetized plasma into space. Because of the blast site’s location on the eastern limb, the cloud will not hit Earth. There won’t be any geomagnetic storms or auroras.

STEREO Spacecraft Approaching Diametric Opposition

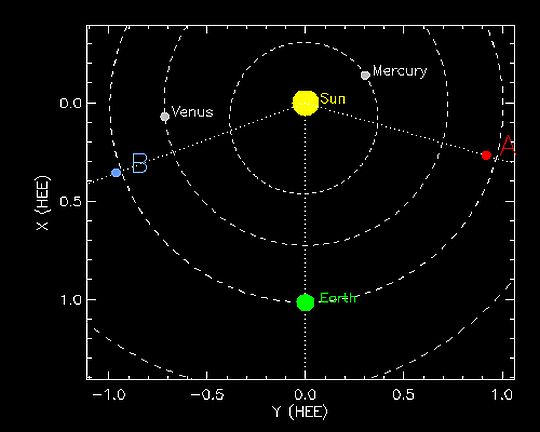
Why would that be significant? Well, it would allow for a full 4PI (360×360°) view of the sun. The animated movie of the sun on STEREO’s Website currently has a gap in the coverage of the sun. The spacecraft are in a heliocentric orbit drifting away from the Earth, one leading and one lagging. This diagram shows the current position of spacecraft A (ahead) and B (behind). The scale is in astronomical units, the average distance between the earth and sun.

Sun-monitoring instrumentation on spacecraft like SOHO and STEREO have gone a long way in discovering what makes the sun behave in mysterious ways. Also, the data coming back (when not intentionally distorted by the IPCC, the CRU or NASA’s James Hansen) can be used to chart the relationship between solar activity and global climate.

stereo.jpg

Anthropogenic Warming – It’s True!

It’s true, but not on a global scale . . .

Increases in local temperature averages are due, in large part, to URBANIZATION. For those of us who bother to seek out actual scientific studies, we can clearly see that Urban Heat Islands are the cause of localized increases in temperature. Consider this study from the Center for the Study of Carbon Dioxide and Global Change:

The Urban Heat Island of Mexicali, Mexico

Background

Mexicali City borders the United States at the northern end of Mexico’s Baja California. It is an urban settlement that had its beginnings in the first decade of the 20th century. At that point in time it had an area of approximately 4 km2; but by 1980 it covered an area of a little over 40 km2, and by 2005 it covered something in excess of 140 km2.

What was done

Working with daily records of maximum and minimum temperature from six weather stations “in Mexicali City and its surroundings” covering the period 1950-2000, and with “a climatic network of rural and urban weather stations in Mexicali and its valley and the Imperial Valley, California” over the “contemporary period (2000-2005),” the authors characterized the spatial and temporal development of the city’s urban heat island over the latter half of the 20th century and the first five years of the 21st century.

What was learned

Garcia Cueto et al. state that Mexicali City “changed from being a cold island (1960-1980) to a heat island with a maximum intensity of 2.3°C in the year 2000, when it was compared with rural weather stations of Imperial, California,” noting that “the replacement of irrigated agricultural land by urban landscapes, anthropogenic activity and population growth, appear to be the major factors responsible for the observed changes.” And from the “more updated information (2000-2005),” they found that “the greatest intensity of the urban heat island was in winter with a value of 5.7°C, and the lowest intensity in autumn with 5.0°C.”

What it means

The results of this study clearly demonstrate that population growth and the clustering of people in cities can lead to localized warming (in areas where temperatures are routinely measured) that is both more rapid and much greater (by as much as an order of magnitude, in fact) than what climate alarmists typically attempt to characterize as the “unprecedented” warming of the 20th century. And that population-growth-induced warming — spread across the world — has likely contributed, in large part, to what they wrongly construe to be CO2-induced global warming.

Simply said, CO2 is NOT a dangerous gas.

Sungrazing Comet

Or should it be SUN-IMPACTOR COMET? I saw this yesterday on SpaceWeather.com:

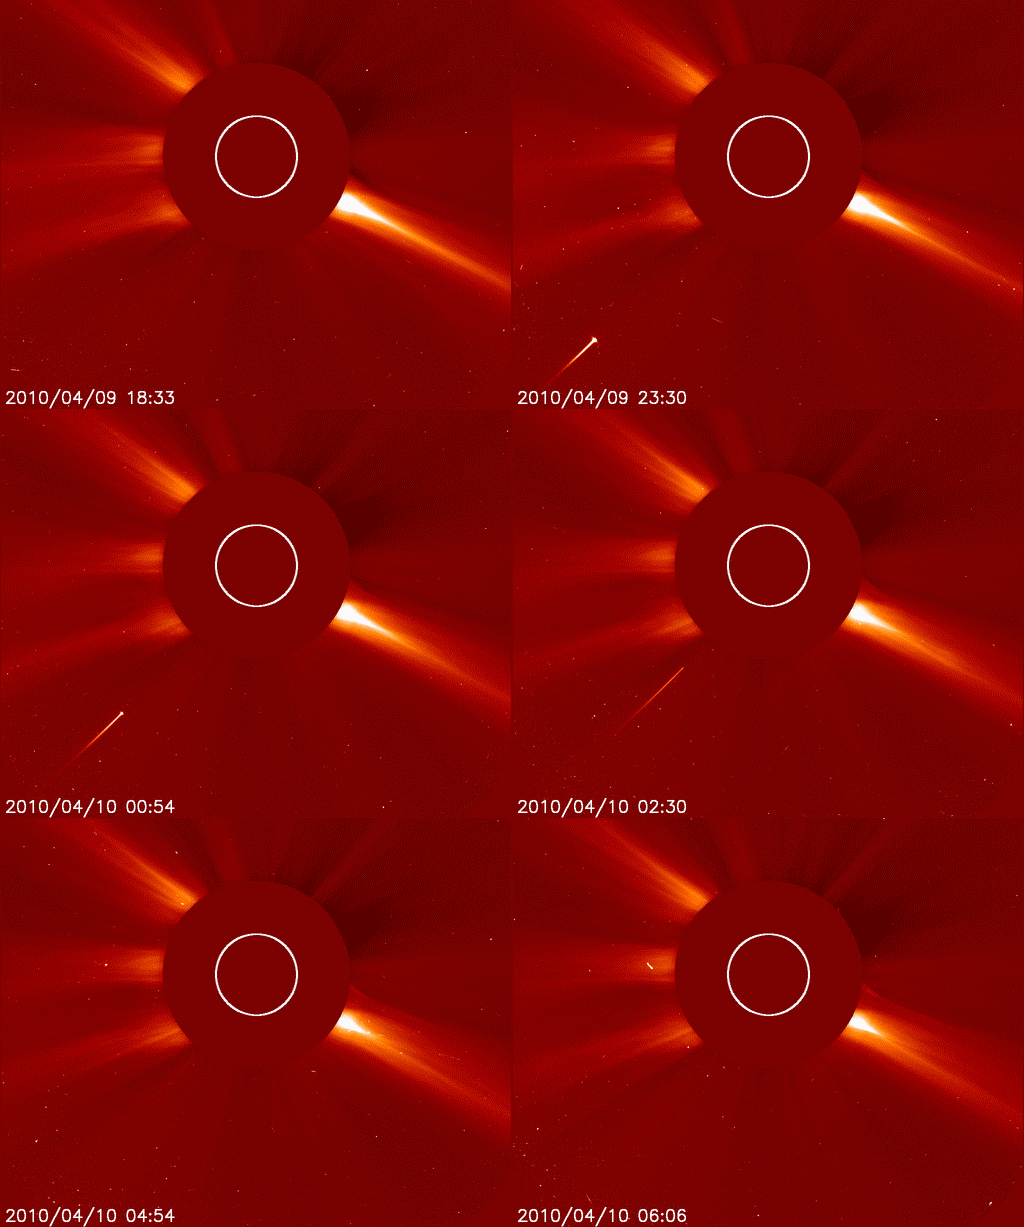
sungrazerSUNGRAZING COMET: Today, the sun had a comet for breakfast. The icy visitor from the outer solar system appeared with no warning on April 9th and plunged into the sun during the early hours of April 10th. One comet went in, none came out. The Solar and Heliospheric Observatory (SOHO) had a good view of the encounter.

The comet was probably a member of the Kreutz sungrazer family. Named after a 19th century German astronomer who studied them in detail, Kreutz sungrazers are fragments from the breakup of a giant comet at least 2000 years ago. Several of these fragments pass by the sun and disintegrate every day. Most are too small to see but occasionally a big fragment like today’s attracts attention.

This has been an active year for big, bright sungrazers. There was one on Jan. 4th, one on March 12th, and now one today. Normally we see no more than 3 or 4 bright ones in a whole year; now we’re seeing them almost once a month. It could be a statistical fluctuation or, maybe, a swarm of Kreutz fragments is nearing perihelion (closest approach to the sun). Stay tuned for doomed comets!

Click on the thumbnail image for full-size movie.

Happy PI Day

March 14th – 3/14 – You know – the ratio of the circumference of a circle to it’s diameter – three-point-one-four something . . .

pi.jpg