
I read an interesting report written by John L. Daly about the emergence of the “hockey stick” paradigm. The “hockey stick” (since the shape of the graph resembles one) graph emerged in 1995 and purports to depict average global temperatures over the last 1000 years or so. The basis of this paradigm, however, can be shown to be flawed.
At the behest of the United Nations’ Intergovernmental Panel on Climate Change (IPCC), Dr. Michael Mann of the Department of Geosciences, University of Massachusetts wrote a report containing the questionable climate graph.
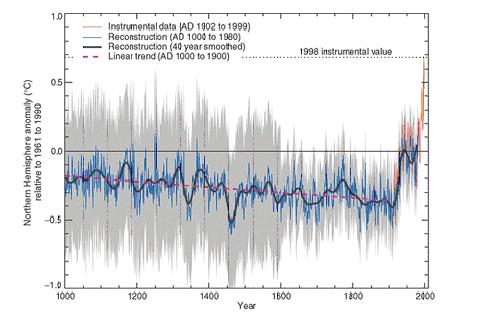
To get the graph, the good doctor grafted data obtained from tree rings worldwide onto the more recent average global temperature data. This is inherently not a good practice to mix data from two completely different sources. Moreover, tree rings are influenced by many factors other than temperature, and the conclusions probably contain errors. Nonetheless, the IPCC immediately embraced the report as evidence that there was “a discernible human influence on global climate.”
John L. Daly in his article The “Hockey Stick” – A New Low in Climate Science presents 14 exhibits of climate science that completely discredit the “hockey stick.” Daly also shows how the biased media can make “stars” out of their favorite scientists as they did with Dr. Mann. This “star” status reduces science to the level of Hollywood, according to Daly.
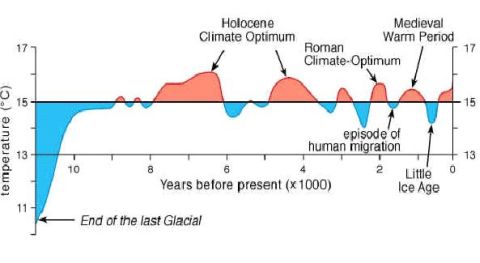
 The graph below shows worldwide temperatures since the last ice age which occurred over ten thousand years ago. The data used to plot this graph have been assembled from reliable scientific research. Notice that over the last 1000 years (see inset), the temperature dropped from the medieval warm period down to the “little ice age” and rebounded since that time. Why, then, does the “hockey stick” not show this? The answer is simple — the “hockey stick” contains flawed data prior to 1900 AD. Notice also that there’s nothing remarkable about the current warming bubble. If solar activity continues to increase, there’s not much anybody can do about it, but will it be that bad or will we simply adapt?
Supporters of the “hockey stick” defend their model by suggesting that the little ice age and medieval warm periods were confined to the northern hemisphere or to Europe. That’s simply not the case according to Daly’s report and to NASA – I prepared a three-phase review on why solar activity is the primary cause of climate fluctuation. In that review, I utilized NASA’s graphics and sunspot data. Together, these demonstrate the world-wide nature of climate fluctuation. Conclusions that I made in that review apply equally to this subject:
- The media will print or broadcast sensationalized headlines to sell copy regardless of scientific value
- The media will print or broadcast manipulated science with half-truths and invalid conclusions to damage politicians with whom they do not agree
- Politicians seize on these unverified claims in order to blame their opponents
- Uneducated/uninformed people are as gullible as ever
And one more conclusion:
- The United Nations is NOT our friend – get us out NOW
References:
Grafting 20th century temperature data onto processed tree ring data? Isn’t that sort of like grafting Sara Jessica Parker’s head onto a chihuahua? (Anyone who saw “Mars Attacks” will realize the ridiculousness of that.)