Don’t bother clicking unless you have sound on with the volume turned up.
I got this idea from a graphic I saw on BMEWS yesterday.

Don’t bother clicking unless you have sound on with the volume turned up.
I got this idea from a graphic I saw on BMEWS yesterday.
We previously posted the prediction of the next solar maximum in this article. Now, another article from NASA on essentially the same topic offers a different twist; the notion of similarities between the terrestrial ocean “conveyor belt” and a conveyor belt phenomenon postulated to occur in the solar interior are considered in the article:
It’s official: Solar minimum has arrived. Sunspots have all but vanished. Solar flares are nonexistent. The sun is utterly quiet.
Like the quiet before a storm.
[more]
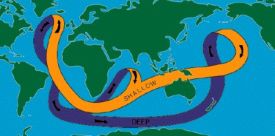 In the article, they refer to the “ocean conveyor belt” which is an attribute of ocean circulation patterns. These patterns can alter the climate in certain areas . For example, the Gulf Stream portion of the “conveyor” keeps Northwestern Europe more temperate than normal for a high-latitude area. Likewise, Hawaii is cooler than many 20th latitude tropical areas due to the California Current, another segment of the “belt.” Left: Illustration of ocean circulation “conveyor belt” – NASA
The article describes the solar circulation pattern a bit more:
The sun’s conveyor belt is a current, not of water, but of electrically-conducting gas. It flows in a loop from the sun’s equator to the poles and back again. Just as the Great Ocean Conveyor Belt controls weather on Earth, this solar conveyor belt controls weather on the sun. Specifically, it controls the sunspot cycle.
[ . . . ]
The top of the conveyor belt skims the surface of the sun, sweeping up the magnetic fields of old, dead sunspots. The ‘corpses’ are dragged down at the poles to a depth of 200,000 km where the sun’s magnetic dynamo can amplify them. Once the corpses (magnetic knots) are reincarnated (amplified), they become buoyant and float back to the surface. Presto — new sunspots!
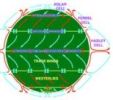 I think the comparison between the solar circulation and Earth’s ocean circulation is interesting, but the circulation of solar plasma is probably more analogous to the triple-cell atmospheric circulation model here on Earth, where there is lateral motion due to the rotation of the planet and Coriolis forces. Since the sun is effectively gaseous (albeit dense), the same sorts of forces should be in effect.
Left: Triple circulation cell illustration – WikiPedia
Don’t forget that both conveyor belts on Earth are driven by the energy of the Sun. The added insight into the Sun’s most complex workings will continue to benefit mankind. As solar research continues and we learn even more about the Sun, it will better enable us to prepare for the terrestrial effects of solar activity, whether it be for colder or warmer.
We’re enjoying an indoor day here since the weather is a bit inclement. Not much to blog about when you’re just being lazy, so I’ll post this interesting picture from the local garden emporium’s succulent section. Interesting colors and textures – a change from the usual.

This seems like a rather important discovery — where there’s water, there *could be* living microorganisms. We’re staying tuned to this . . .
View a NASA Video about “Cold Faithful”.
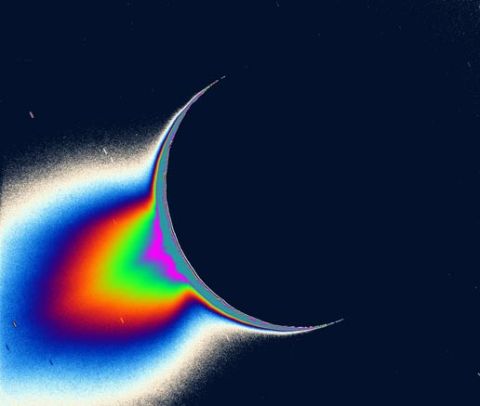
Image above from NASA – an infrared false-color view of the “Cold Faithful” Geyser on Enceladus.
Due to rearrangement of the Defense Budget, a couple of the candidate Unmanned Combat Aerial Vehicle (UCAV) programs will be replaced by more up-to-date technologies and mission requirements. From GovExec.com:
Replacing the Joint Unmanned Combat Air System –consisting so far of two Boeing X-45A prototype smart aircraft and a Northrop Grumman X-47A demonstrator –with a longer range unmanned aircraft will save $158 million next year.
Although NGC’s X-47A project is discontinued, it must have been great to be a part of the development team that flew the Pegasus prototype. What a rush a cool toy like this must bring . . .
Press the > button to play. The .wmv file size is about 4 MB.
UPDATE: I’ve been advised that some browsers can’t view the file. If you aren’t able to see the video, you can download it.
Crocus is a genus of perennial flowering plants that grows from a corm (a tuber or root), which is native from the Aegean, across Central Asia. Often referred to as “Dutch” Crocus, these were only seen in Europe after the 16th century. The spice saffron is obtained from the stamens of Crocus sativus, a fall-blooming species. The name of the genus is derived from the Latin adjective crocatus, meaning saffron yellow.

I photographed this little beauty where it lives in a whiskey barrel planter in the backyard yesterday.
By the way, saffron and rosemary in rice is an elegant side dish, but that’s another blog.
Know Thy Star
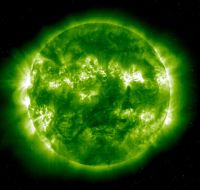 The Sun is a star — a main sequence star whose business is to fuse hydrogen atoms into helium atoms. Fusion is a steady but somewhat unstable and potentially violent thermonuclear process. During fusion, solar mass, heat and pressure force hydrogen atoms to combine to become helium atoms. This transformation of atomic states produces energy in the form of multispectral photons (visible light, heat, x-rays, ultra-violet, cosmic rays, magnetic flux, radio-frequency emissions and more). We all know the effects of UV on skin disease, and lately, the effects of magnetic flux on the electrical grid. The Sun, like fire, can be good and bad.
One day, far in the future, the Sun will run out of hydrogen to fuse and will become a red giant star as it attempts to fuse it’s residual helium into even heavier elements – but since it is a relatively small star, it falls short of the mass and energy needed to do so. The Sun will gradually expand to an unsustainable maximum where it suddenly collapses, and then goes nova, literally exploding its outer shell into space while its high-density core remains and will become a white dwarf star. The explosion and collapse will occur in about five billion years. In the meantime, the Sun will continue its steady fusion process and occasional chaotic behavior, which (as meteorologists and stockbrokers know) cannot accurately be predicted.
Yogi Berra’s Law: “You can observe a lot just by watching.”
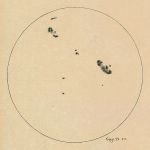 Over the last four hundred years, astronomers and others have recorded their observations of the Sun; they observed a phenomenon known as “sunspots” and jotted down when they saw them, how many there were and how big, of course. Galileo, among other observers, often drew sketches of the solar disc depicting sunspot orientation. The historical records from this period are quite compelling.
Image: A sketch of the sun made by Galileo in June 1613 (NASA).
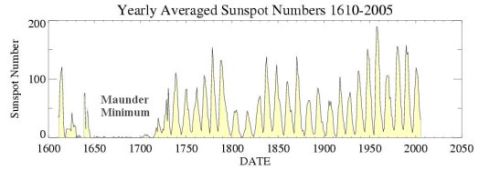
And those records appear in the graphic below (courtesy NASA) along with subsequent observations. You should notice that the number of sunspots (which corresponds to the intensity of solar activity) shrinks and grows over an eleven year (or so) cycle. Some cycles have greater intensity than others. You should also notice a gap in this behavior where the graphic is labeled “Maunder Minimum,” during the years (approximately) between 1645 and 1715. During that 70 year period, less than one sunspot per year (on average) was observed. During that same period, the Earth experienced what is called the “Little Ice Age” where winters were bitterly cold.
Let’s review:
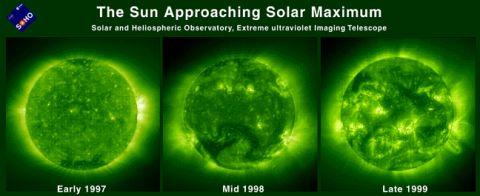
Science makes a lot of assumptions based on observations. Maybe it’s the things we can’t observe that makes the Sun behave the way it does. There is evidence that the Sun’s rate of rotation oscillates over time, its magnetic fields wander and vary in strength, and of course has occasional Coronal Mass Ejections (prominences). The Sun may actually be, to a somewhat lesser degree than most, a variable star; some variables’ light and radiation fluctuate by 100 to 1 over short periods of time (months or years our time). Were the Sun to be in that category, however, it is doubtful that there would be any life on Earth. The following images in ultraviolet light clearly illustrate the contrasts in solar activity from the last sunspot cycle in the run up to maximum (courtesy SOHO):
Conclusions:
One more thing – the Antarctic Ozone Hole gets larger in the antarctic spring and smaller in the antarctic fall. Sunshine opens the hole, darkness closes it. The hole also grows and shrinks in direct proportion to the number of sunspots. No surprise here is there? Could the “chlorofluorocarbon emissions cause atmospheric ozone depletion” meme also be a myth?
Global Warming doomsayers ought to re-think what really affects the climate and stop beating their broken drum. Do the numbers and have a closer look at our stellar companion, the greatest of all climatological influences, the giver of life, and, ultimately the taker as well.
Reference for Maunder Minimum data: Wikipedia – Maunder Minimum
UPDATE: Read more about Correlating Sunspots to Global Climate in a subsequent article.